XRP News Could Cause XRP Price Breakout
[ad_1]
The XRP price is making yet another attempt at breaking out from its symmetrical triangle pattern. If successful, a sharp upward movement could follow. Positive XRP news in the form of a Ripple vs SEC case resolution could assist this outlook.
In a Jan. 30 appeal hearing in the LBRY vs SEC case, a United States judge gave a summary judgment and decided to limit the Securities and Exchange Commission (SEC) oversight in secondary crypto markets. This could have a positive effect by setting a precedent for the securities law that could then be used in the Ripple vs SEC ruling since the latter uses the vague “secondary market” terminology in its Ripple case.
Moreover, the London-based IG bank published an article on the Ripple Labs vs SEC case, stating that its outcome could see the XRP price soar and benefit the cryptocurrency market at large.
XRP Price Consolidates Below Resistance
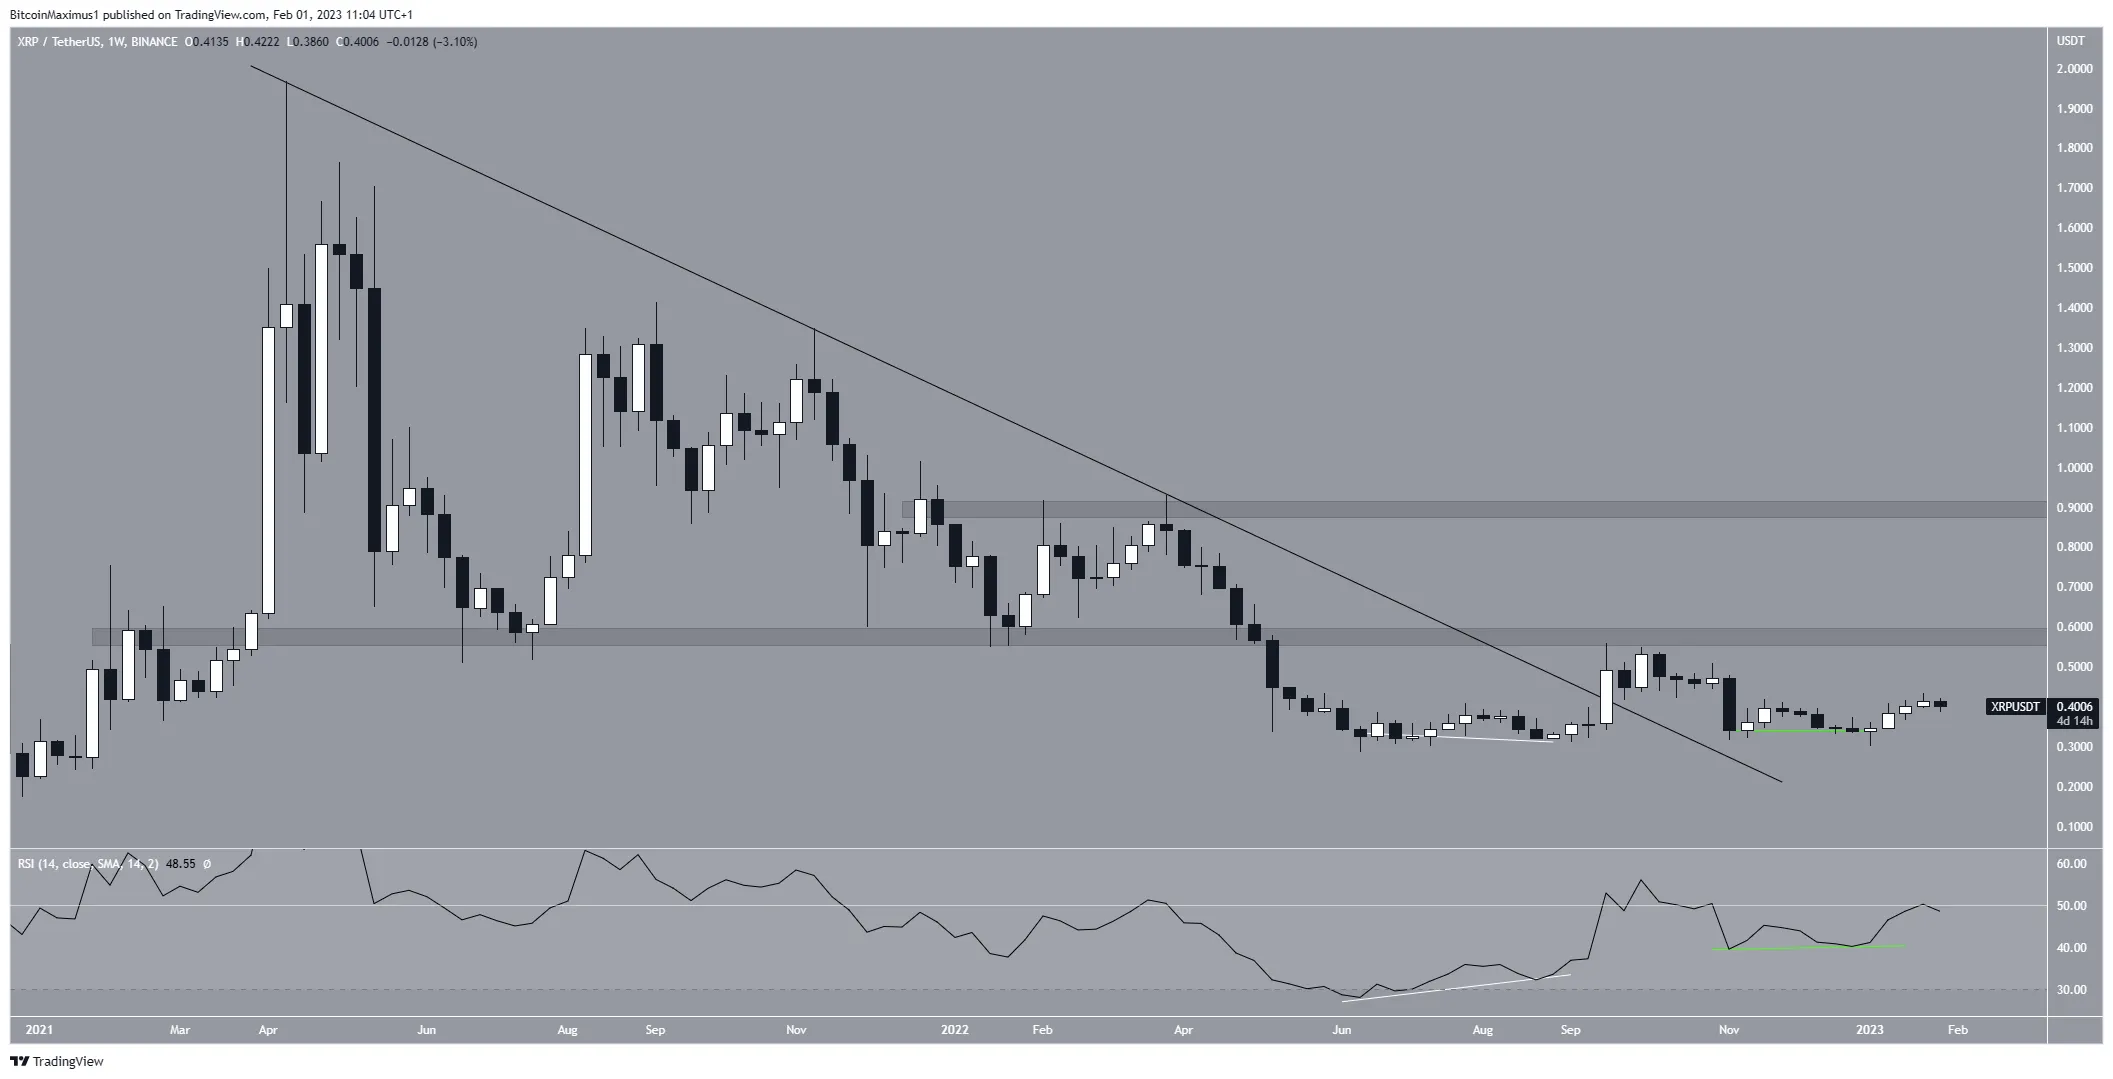
Since April 2021, the price of XRP had fallen below a declining resistance line. The decline resulted in a minimum price of $0.287 in June 2022.
After that, the price began to climb upward, and in Sept. broke out from the resistance line due to a bullish divergence in the weekly RSI (white line). Its rising trend was unable to be maintained, so it is currently trading below its breakout level.
However, the future outlook remains bullish. The main reason for this is that the weekly RSI has created another bullish divergence (green line). So, the price may still advance to the $0.580 horizontal resistance region. If it moves above it, it could increase toward an average price of $0.900.
On the other hand, a weekly close below $0.300 would be bearish and could drive the XRP token price toward $0.200.
Will Breakout Ever Happen?
The daily chart’s technical analysis reveals that since June 2022, the movement of the XRP price has been constrained by a symmetrical triangle. The symmetrical triangle is regarded as a neutral pattern, although the price movement exhibits several bullish indicators. As a result, it makes a breakout from the digital asset likely.
Firstly, on Jan. 2, the price of XRP produced a bullish hammer candlestick (black icon). The candlestick started the current upward momentum and prevented the triangle from collapsing. The XRP price then recaptured the horizontal $0.385 area and confirmed it as support (green icon).
Over the past 24 hours, the XRP price has been rejected by the triangle and fallen. However, the daily RSI has generated a hidden bullish divergence (green line). This is a strong sign of trend continuation, which could lead to a breakout. If it does, $0.505 would be the next point of resistance.
However, a close below $0.385 would invalidate the bullish XRP forecast and could drive the price back down to $0.340.
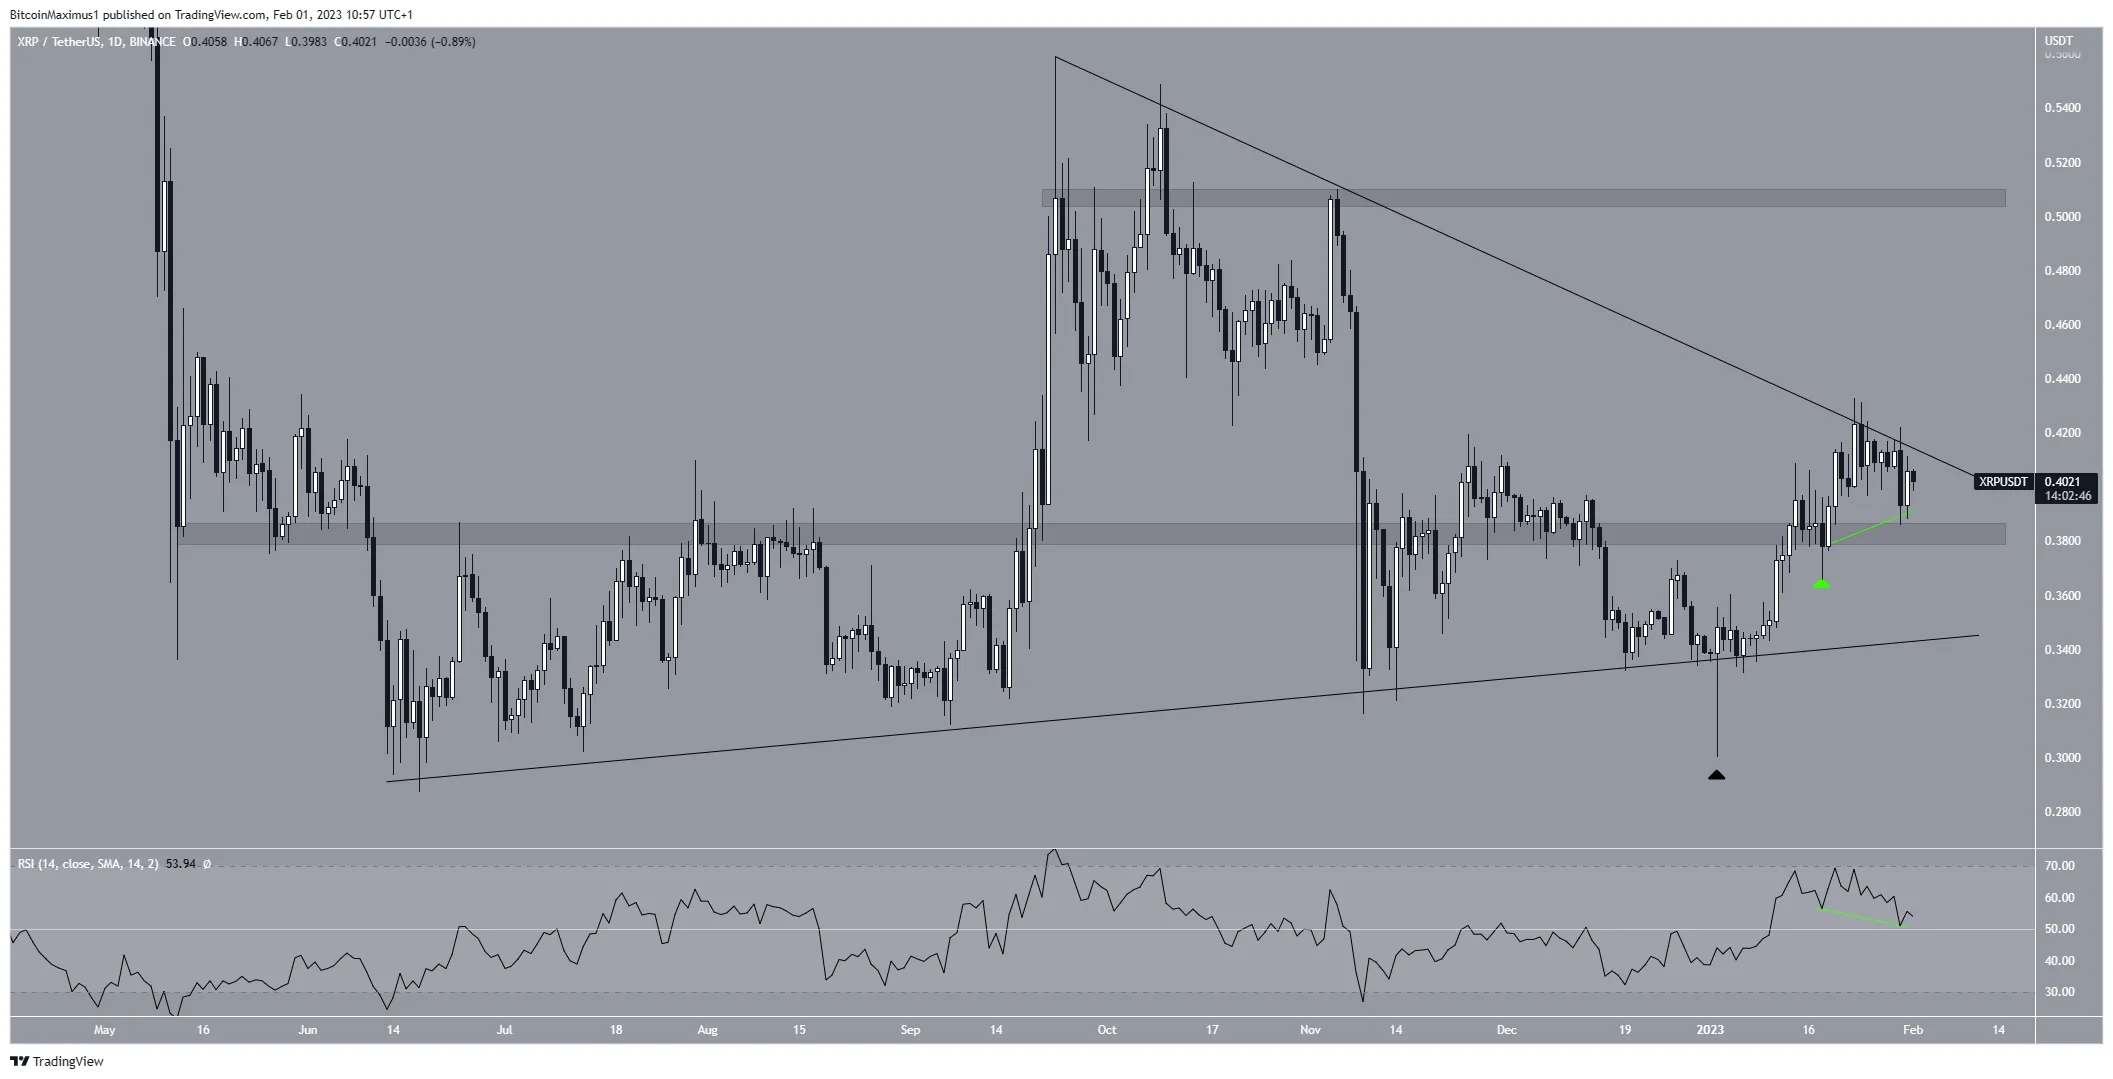
In conclusion, a breakout from the triangle followed by an increase to $0.505 is the most likely XRP price forecast. A daily close below $0.382 would invalidate this bullish perspective and push the price of XRP back down to the support line at $0.340.
For BeInCrypto’s latest crypto market analysis, click here.
Disclaimer
BeInCrypto strives to provide accurate and up-to-date information, but it will not be responsible for any missing facts or inaccurate information. You comply and understand that you should use any of this information at your own risk. Cryptocurrencies are highly volatile financial assets, so research and make your own financial decisions.
[ad_2]
Source link