On-Chain MVRV Indicator Lights Up Bitcoin Bull Market Path

[ad_1]
The crypto market is always in a state of flux, with prices soaring and plummeting regularly. However, a recent development may signal the start of a long-term bull market for Bitcoin and altcoins.
An important on-chain Bitcoin indicator, the MVRV, has broken out of the oversold territory, and historically, this event has signaled the beginning of a bull market.
Understanding the MVRV and How it Works
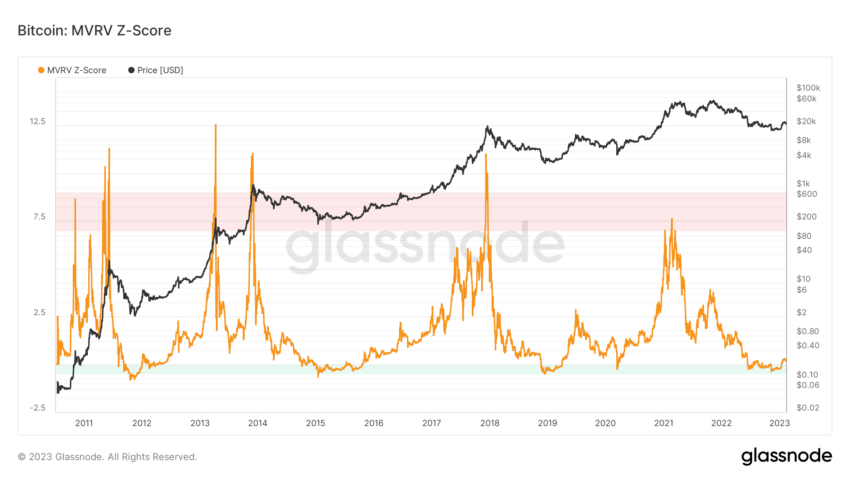
MVRV stands for Market Value to Realized Value ratio, a long-term Bitcoin indicator. It estimates when the price of BTC is below its so-called “fair value.” Its derivative, the MVRV Z-Score, is used to determine whether Bitcoin is overvalued or undervalued relative to its “fair value,” taking into account the standard deviation of all historical market capitalization data.
The MVRV Z-Score typically moves in three ranges, but it can occasionally move out of them during extreme bull or bear market conditions.
The green area between 0 and -0.5 is interpreted as the Bitcoin price being below “fair value”, the neutral range between 0 and 7 is considered the “fair value” range, and the red area between 7 and 9 is interpreted as the Bitcoin price being above “fair value.”

Historically, when the MVRV Z-Score was in the green area, it signaled a period of the Bitcoin price bottom. Conversely, when the indicator was in the red area, it signaled an impending peak and overbought period in the BTC market.
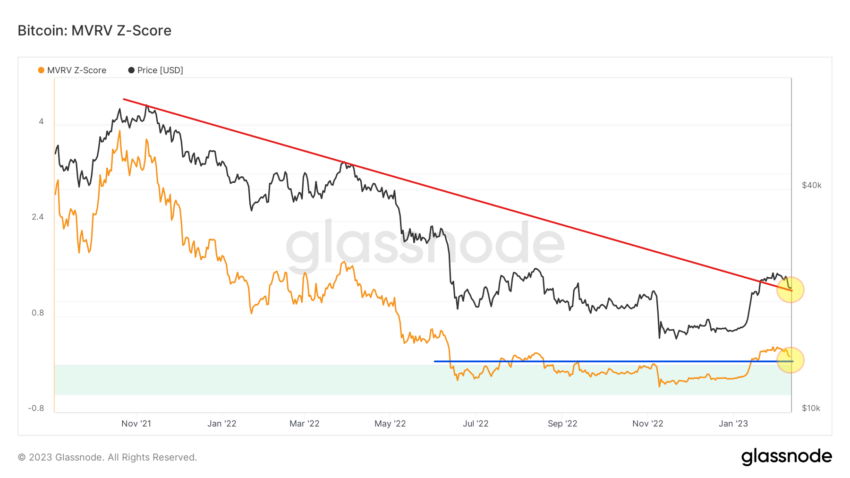
Currently, the MVRV has broken out of the buying area, which has corresponded with the accumulation of the BTC price in the past.
Bitcoin Exits Buy Zone
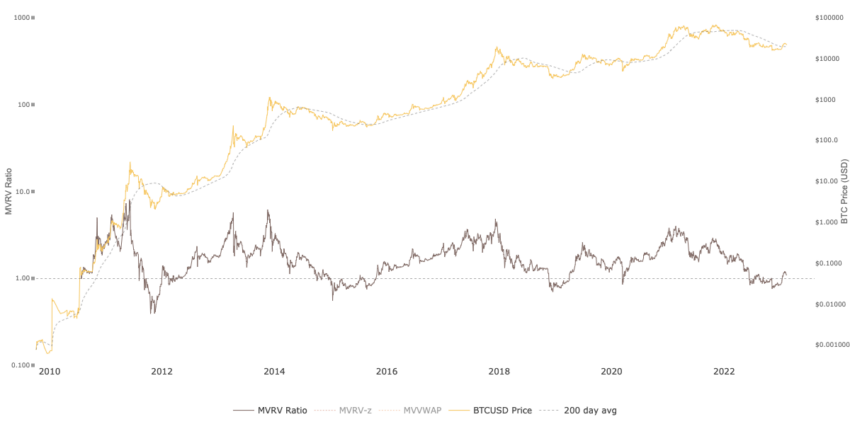
Cryptocurrency market analyst @CryptoNoob_1 recently tweeted a chart of MVRV, highlighting the drops below the 200-day average and pointing out that the recent January increases in the BTC market led to a breakout from this area. He said that “the price has always risen rapidly after this event.”
While this is a promising development, there have been periods of fakeouts in the past, where the indicator broke out but later returned to test it again.

Still, with the BTC price breaking out of the long-term logarithmic resistance line (red) since its all-time high of $69,000 on November 10, 2021, and the MVRV Z-Score heading for a re-test of the oversold area (blue line), both events may occur simultaneously, providing strong evidence for the resumption of the crypto bull market.

Skepticism Reigns
The crypto market has been experiencing an interesting dislocation as of late. On the one hand, some retail traders are skeptical that Bitcoin bottomed in November. On the other hand, options contracts are signaling a strong confidence that the bottom has indeed been reached.
This dichotomy has created a unique opportunity for investors who can make accurate predictions about the crypto market’s future. For those who believe that new lows are on the horizon, a great trade awaits.
One key indicator of this potential for a great trade is the delta for 15,000 BTC, priced at 0.14 and going into 2024, using December 23 as a proxy.
This delta is a measure of the change in the option’s price relative to a change in the underlying asset’s price. In this case, a low delta indicates a lower sensitivity of the option price to changes in the price of Bitcoin, implying a lower risk.
Disclaimer
BeInCrypto strives to provide accurate and up-to-date information, but it will not be responsible for any missing facts or inaccurate information. You comply and understand that you should use any of this information at your own risk. Cryptocurrencies are highly volatile financial assets, so research and make your own financial decisions.
[ad_2]
Source link

