Bitcoin (BTC) Price Drop Puts $30,000 Level at Risk

[ad_1]
The price of Bitcoin (BTC) has been trading in a corrective pattern since June 23, likely in response to the previous upward movement.
While the BTC price briefly reached a new yearly high on July 5, the price action since supports the possibility of more downside. This also aligns with the wave count and RSI readings.
Bitcoin (BTC) Price Drops After Bearish Candlestick
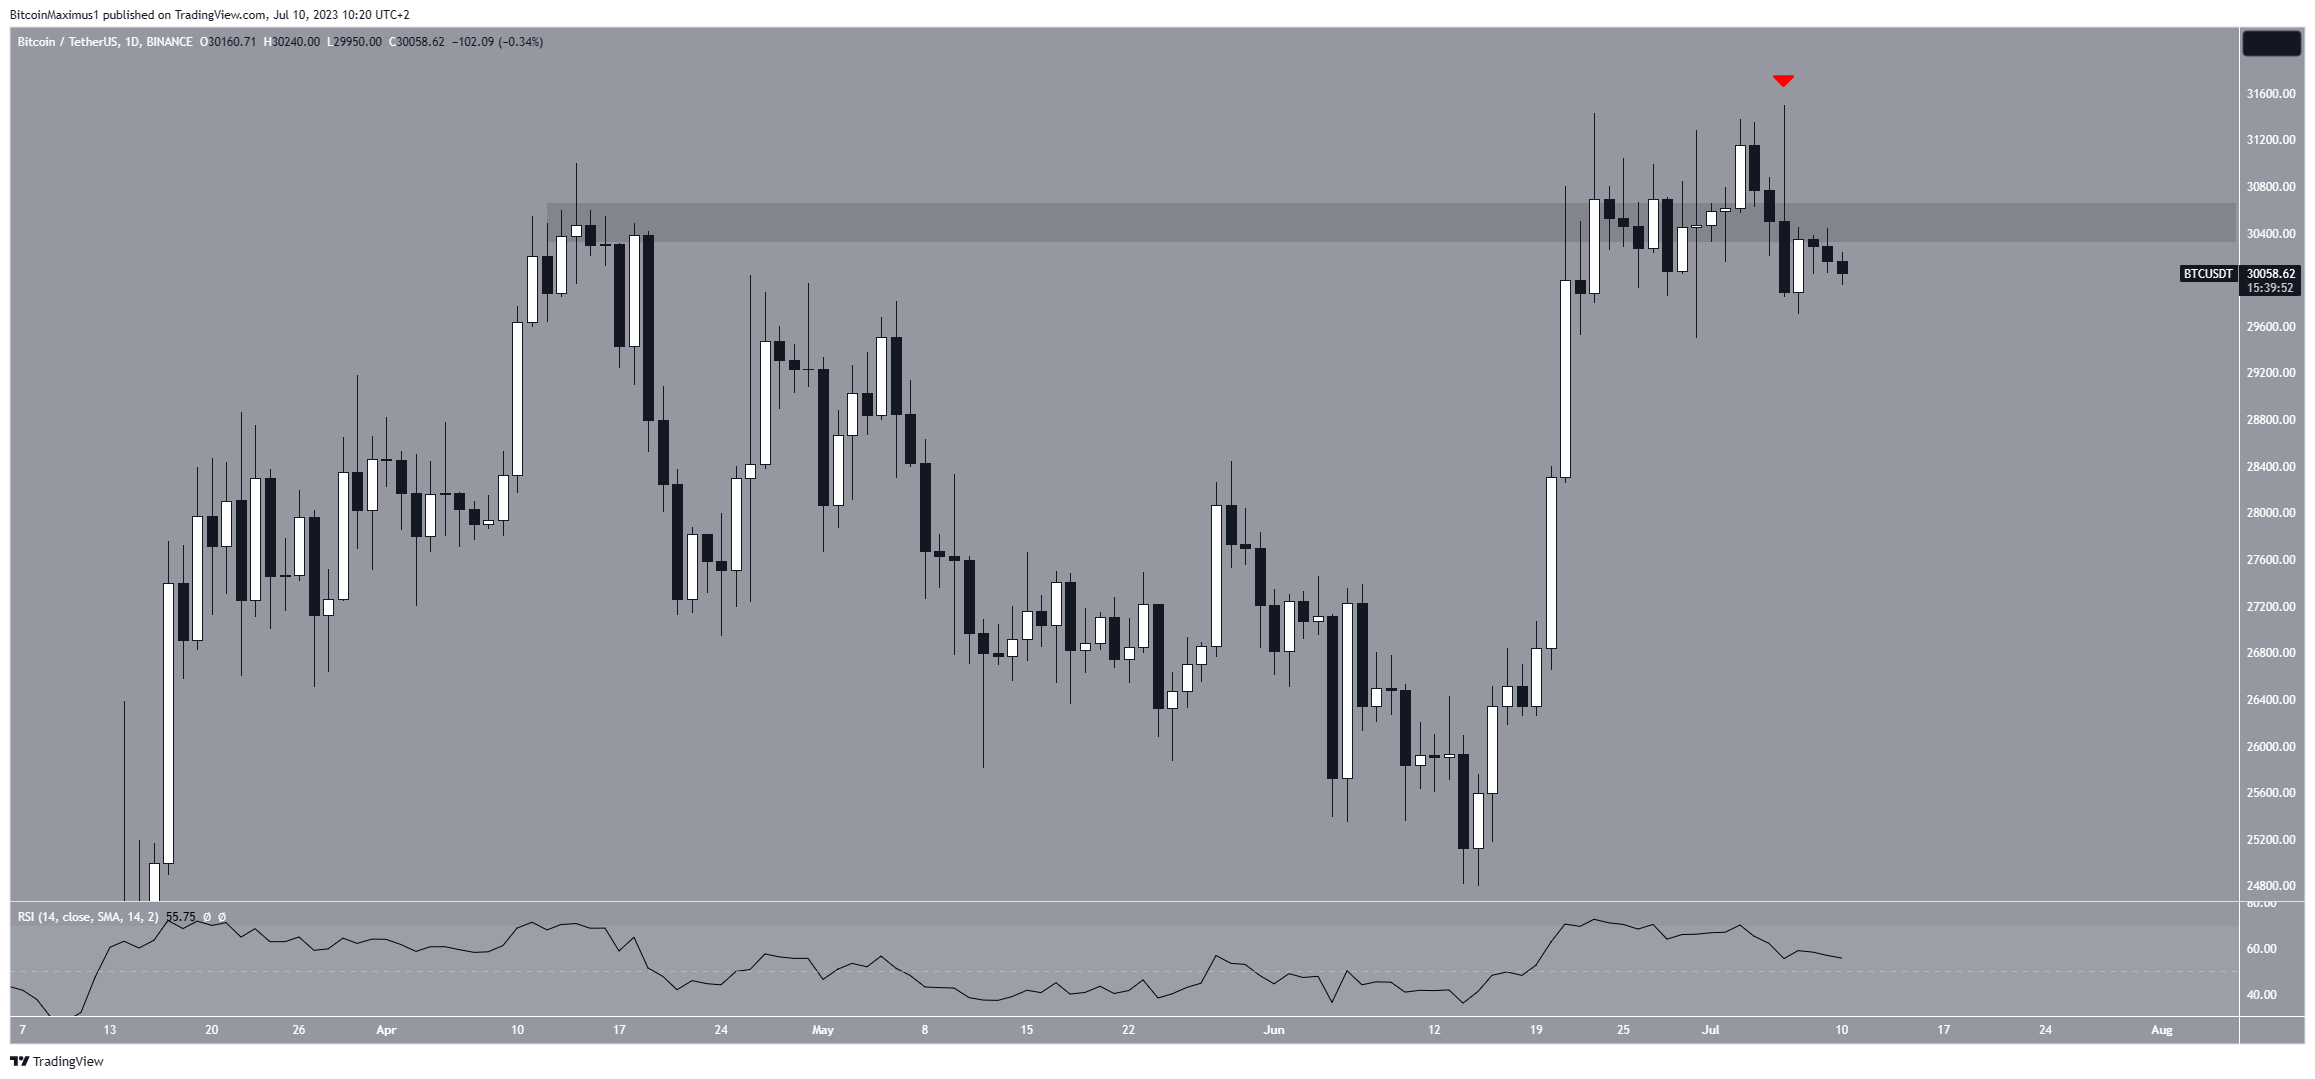
The daily time frame technical analysis shows that the BTC price fell right after reaching a new yearly high of $31,500 on July 6. The same day, it created a shooting star candlestick. This is a type of bearish candlestick that occurs in local tops. A long upper wick and a bearish close characterize it. It signifies that despite a previous increase, sellers took over and caused the price to fall considerably below its high and opening price.
Moreover, the candlestick caused the BTC price to close below the $31,500 horizontal resistance area. This is another bearish sign that further legitimizes the shooting star candlestick.

However, the daily RSI gives a mixed reading. The RSI is a momentum indicator used by traders to assess market conditions and determine whether to buy or sell an asset, also indicating bullish sentiment.
A reading above 50, along with an upward trend, suggests that buyers still have an advantage, while a reading below 50 suggests the opposite. While the RSI is falling, it is still above 50. Thus, the indicator provides conflicting readings.
BTC Price Prediction: Wave Count Suggests Initial Fall Will Precede Price Surge
A more detailed analysis of the short-term six-hour time frame reveals a bullish long-term outlook but a bearish short-term one. This is mostly because of the wave count.
Elliott Wave theory involves the analysis of recurring long-term price patterns and investor psychology to determine the direction of a trend.
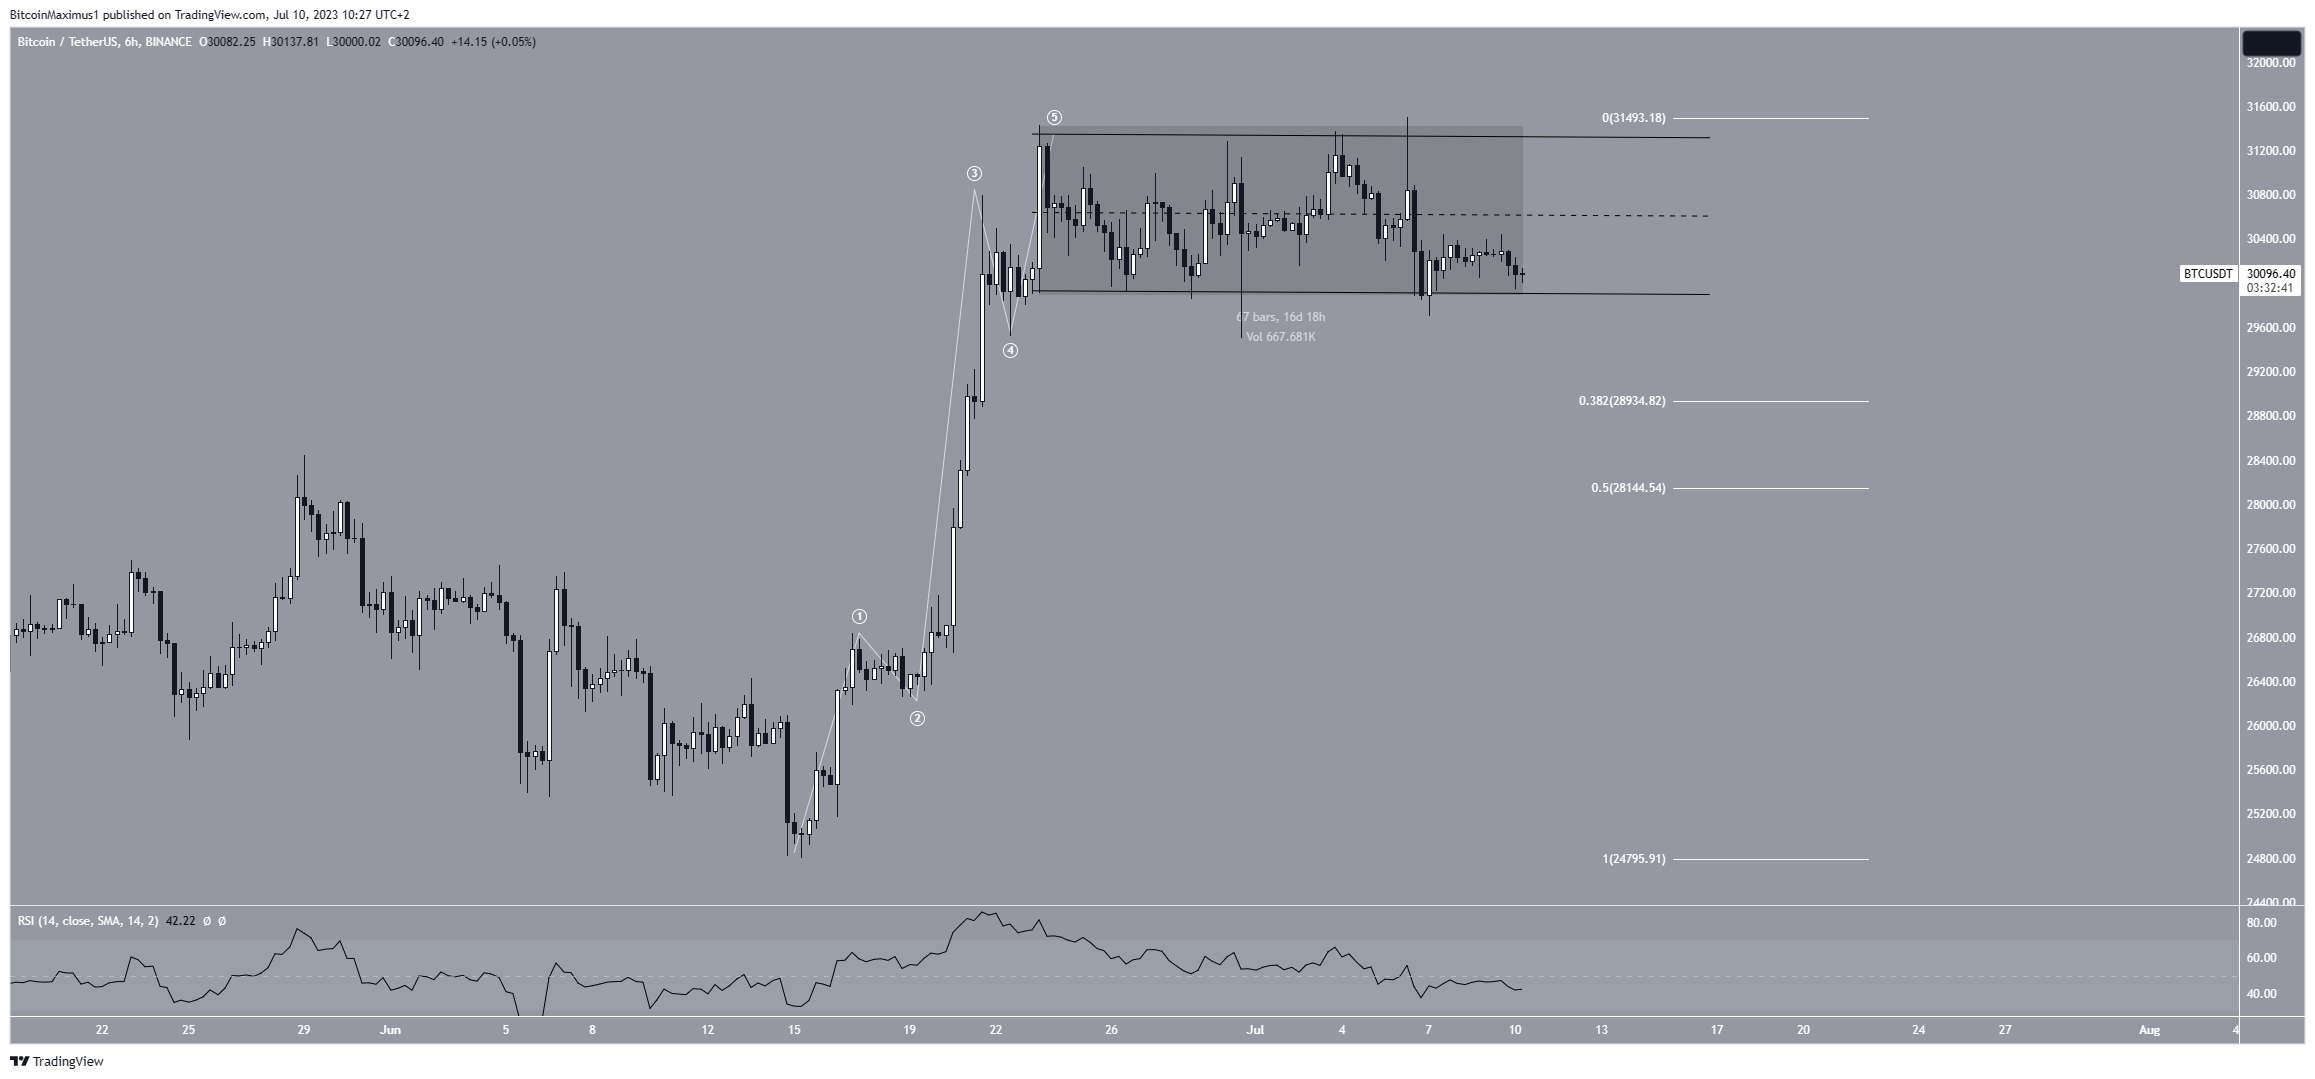
The wave count suggests that the BTC price completed a five-wave upward movement that began on June 15. If so, the movement since the initial high on June 13 has been corrective (highlighted). The fact that the price action is contained inside a parallel channel supports this possibility.
Therefore, if the count is correct, the BTC price will break down from the channel and fall to the 0.382 Fib retracement support level of $28,900 or even the 0.5 one at $28,150.
Then, the previous long-term upward movement can continue.
Finally, the six-hour RSI supports the possibility of the breakdown. The indicator is decreasing and is below 50, both signs of a bearish trend.

Despite this bearish short-term BTC price prediction, moving above the wave-five high of $31,500 will mean that the correction is complete and the trend is bullish. In that case, the BTC price will likely break out from the channel and increase to the next resistance at $36,000.
For BeInCrypto’s latest crypto market analysis, click here.
Disclaimer
In line with the Trust Project guidelines, this price analysis article is for informational purposes only and should not be considered financial or investment advice. BeInCrypto is committed to accurate, unbiased reporting, but market conditions are subject to change without notice. Always conduct your own research and consult with a professional before making any financial decisions.
[ad_2]
Source link

