Is a Chainlink (LINK) Price Correction Imminent?

[ad_1]
Chainlink price has been trending upward for the past few weeks, with momentum seemingly slowing down over the last 48 hours.
However, what’s more interesting is that whales have been signaling an impending correction for a long time now that might arrive rather soon.
Chainlink Whales Might Induce Bearishness
Chainlink price recently tagged the $21.69 resistance level, marking a 25-month high. The Oracle token corrected soon after dropping by 5.66% as of today. At the time of writing, LINK can be seen trading at $20.47.
By the looks of it, a decline is likely incoming, and the behavior can be the same for the investors. Whale investors, in particular, have been signaling a downtrend for some time now. Addresses holding between 10,000 and 100,000 LINK have been consistently selling since the beginning of February. In a month and a half, their supply has declined by nearly 2 million LINK worth over $40 million.
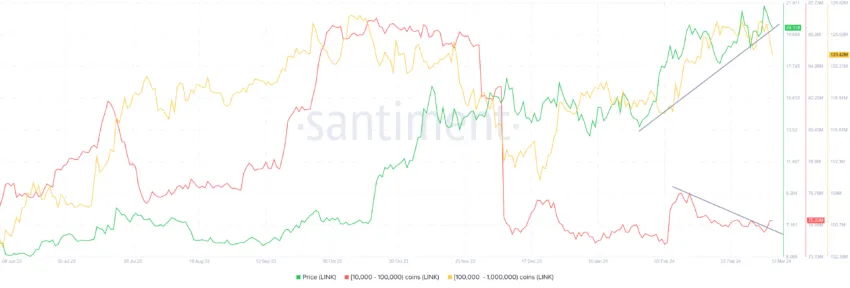
These whale addresses have historically proven to be a solid signal of a trend reversal as price rises have followed their accumulation, and selling has resulted in corrections. This makes their recent selling an indication of what is to come.
Read More: Chainlink (LINK) Price Prediction 2024/2025/2030
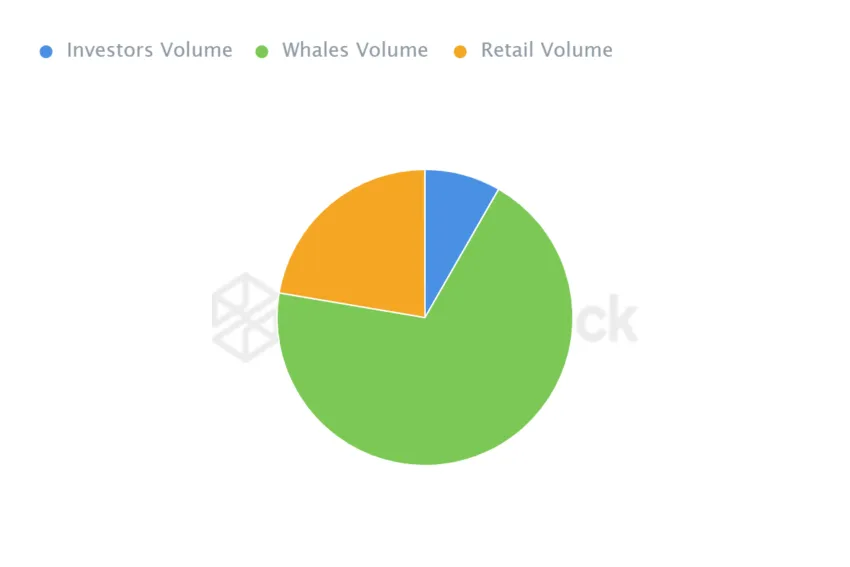
Furthermore, whales significantly influence the price action of LINK specifically because about 69% of this cohort’s entire circulating supply of LINK sits in the wallets. The remaining 31% of the supply is divided among fish and smaller wallet holders.
Now, a price decline is expected and has not arrived yet because the sales are not as significant and sudden as they were in the past. This has resulted in a bearish divergence, which will be corrected once LINK notes a decline.
LINK Price Prediction: All in Favor of Whales
While Chainlink’s price is rising slowly, the altcoin can be seen losing the bullish momentum in shorter time frames. This is further verified by the negative signals exhibited by the Moving Average Convergence Divergence (MACD) indicator.
The MACD tracks the relationship between two moving averages of a security’s price. It helps identify trend direction, momentum, and potential buy or sell signals by measuring the difference between short-term (indicator line) and long-term moving averages (signal line).
At the time of writing, the indicator notes a bearish crossover with red candles registered on the histogram. The 50-day Exponential Moving Average (red) is also presently above the candlestick. This is considered a short-term bearish signal, suggesting LINK could likely see a decline to $20.12.
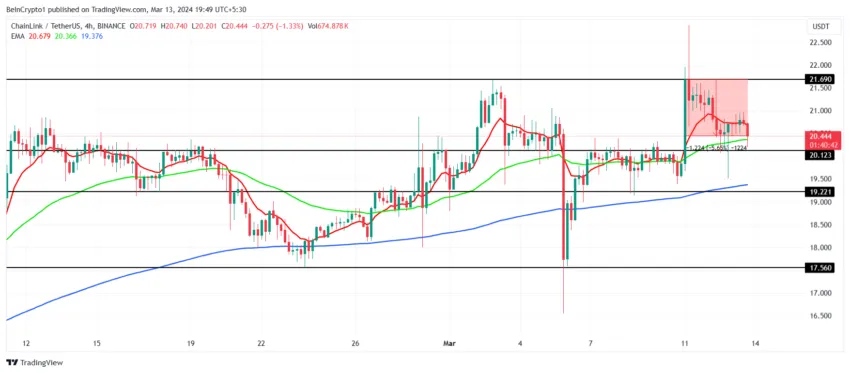
If the bearish sentiment weighs heavily on Chainlink’s price, it could fall further to test the support level at $19.22.
Read More: What Is Chainlink (LINK)?
However, the 100-day EMA (green) is acting as a support line for LINK. The Oracle token could sustain above $20.12 if it prevents a considerable decline. Supplemental support from retail investors could flip the potential downtrend. This would invalidate the bearish thesis by pushing the altcoin above $21.
Disclaimer
In line with the Trust Project guidelines, this price analysis article is for informational purposes only and should not be considered financial or investment advice. BeInCrypto is committed to accurate, unbiased reporting, but market conditions are subject to change without notice. Always conduct your own research and consult with a professional before making any financial decisions. Please note that our Terms and Conditions, Privacy Policy, and Disclaimers have been updated.
[ad_2]
Source link