SHIB Price Stalls? Transaction Size Hints at Downturn

[ad_1]
The Shiba Inu (SHIB) price has seen a sharp decline, highlighted by a 60% fall in average transaction size in just four days. This substantial decrease could indicate fading investor interest in Shiba Inu, possibly signaling a change in the previously bullish market sentiment.
The SHIB RSI remaining in the overbought zone suggests that further price corrections could be on the horizon. Additionally, the consolidation pattern formed by the EMA lines indicates that SHIB’s price may stabilize at current levels, hinting at a potentially difficult period ahead for maintaining its recent upward momentum.
Shiba Inu Transaction Average Size Is Still Declining Heavily
Reviewing the average transaction size of SHIB over the past month reveals a fascinating pattern. From February 21 to March 11, it surged from $10,139 to $49,816, marking a 391% increase in just about three weeks.
During this timeframe, SHIB price also rose from $0.000009 to $0.000033, achieving a 266% growth. This recent bullish phase shows a clear correlation between these metrics.
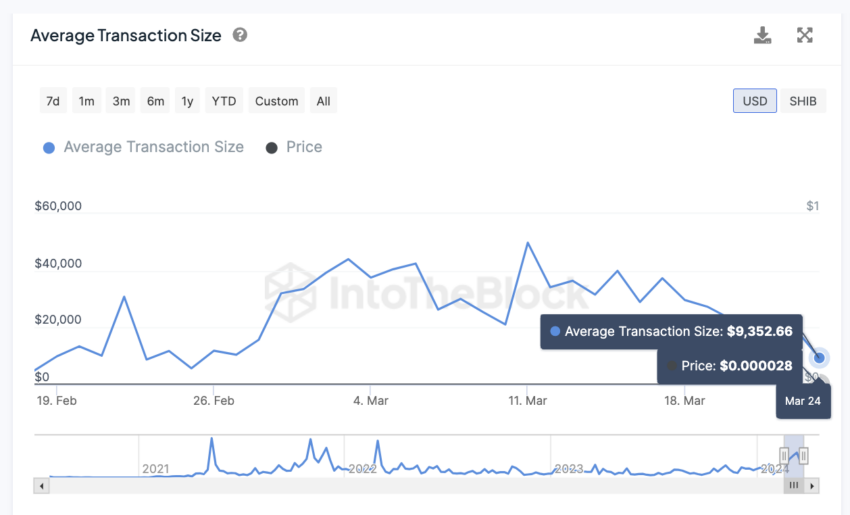
Subsequently, the average transaction size experienced further growth before undergoing a significant decline. Specifically, it dropped from $49,816 on March 11 to $9,352 on March 24, an 81.23% decrease. Particularly in the last four days, the average transaction size for SHIB declined by 60%.
Given the apparent correlation between these two metrics in recent months, the substantial gap between the drop in average transaction size and the price correction suggests that SHIB prices may face further declines in the coming days.
Read More: How To Buy Shiba Inu (SHIB) and Everything You Need To Know
This Metric Indicates the SHIB Price May Be Overheated
SHIB might be due for a reality check, even after the recent price drop. The sky-high RSI of 81 is flashing a caution sign. With a reading that far above the 70 mark, SHIB might be a bit overheated right now. This could prime the pump for a SHIB price pullback.
Think of RSI as a gauge for a buying frenzy. When it rockets past 70, it suggests the asset might be due for a correction as the market seeks equilibrium between buyers and sellers.
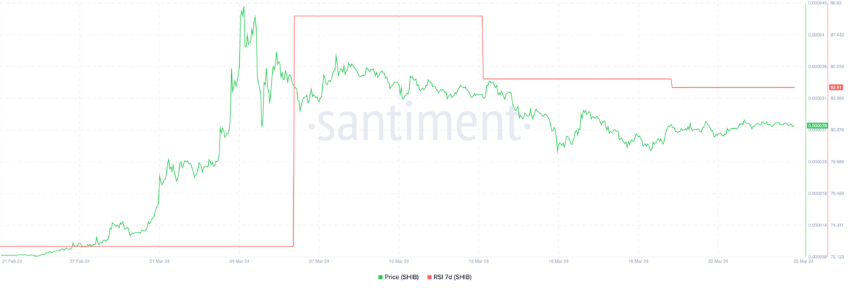
The RSI, a technical analysis darling, oscillates between 0 and 100, reflecting the momentum and rate of price swings based on recent highs and lows. SHIB RSI might have cooled down a tad from 88 on March 11 to 83 by March 25, but it’s still undeniably in overbought territory.
Traditionally, investors see this as a bearish signal. It suggests the asset has been on a buying spree that might not be sustainable. So, the expectation is for a potential price drop as the market naturally adjusts to this situation, bringing SHIB closer to its true value.
SHIB Price Prediction: More Consolidation Ahead?
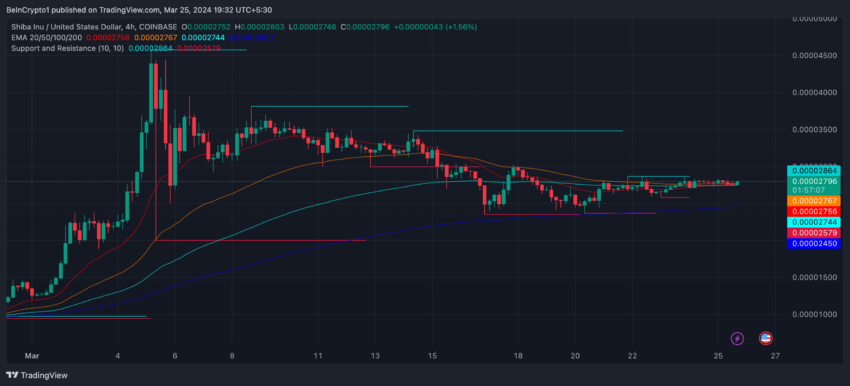
SHIB exhibits a potentially bearish technical indicator based on its Exponential Moving Averages (EMAs). The short-term EMAs are approaching a crossover below the long-term EMAs. This technical analysis suggests a possible decline in price if the current trend persists.
However, the current market sentiment surrounding SHIB remains unclear. The close proximity of all EMA lines to the current price indicates a period of consolidation. During consolidation, the price of SHIB has the potential to break out in either direction depending on future market developments and overall sentiment.
It is important to remember that EMAs are weighted averages that place greater emphasis on recent price movements. This characteristic allows them to react more swiftly to market changes compared to Simple Moving Averages (SMAs).
EMAs serve as valuable tools for identifying trends and potential price reversals. A bearish outlook is associated with a downward crossover (short-term EMA falls below long-term EMA), while the converse is true for a bullish signal.
Read More: 11 Best Shiba Inu (SHIB) Wallets in 2024
Given this scenario, the SHIB price should stay in the $0.000023 to $0.000028 range. However, if a strong downtrend occurs and the $0.000023 support isn’t enough, it could retest old support at $0.000009. On the other hand, a new bull run could test $0.000045 again.
Disclaimer
In line with the Trust Project guidelines, this price analysis article is for informational purposes only and should not be considered financial or investment advice. BeInCrypto is committed to accurate, unbiased reporting, but market conditions are subject to change without notice. Always conduct your own research and consult with a professional before making any financial decisions. Please note that our Terms and Conditions, Privacy Policy, and Disclaimers have been updated.
[ad_2]
Source link